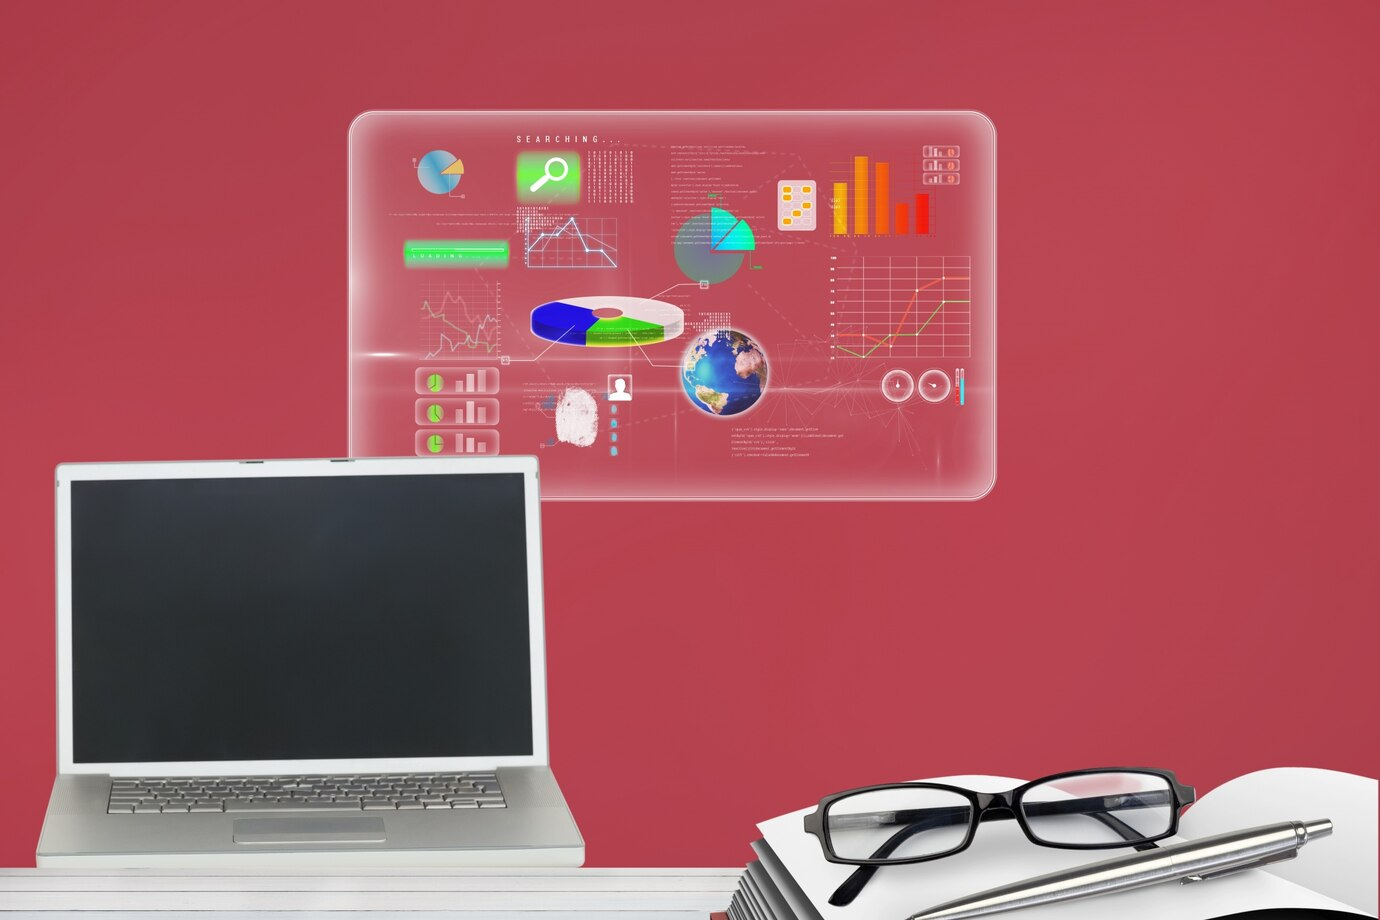
Top Features to Look for in Executive Dashboard Software

In a world where business decisions need to be made faster and with greater precision, executive dashboard software has become indispensable. These tools provide high-level insights by aggregating data from multiple sources, enabling leaders to monitor performance and make informed decisions in real time.
However, not all dashboard software is created equal. To maximize its benefits, the right software should include features that cater to an organization’s unique needs. This article explores the essential features to look for in executive dashboard software, using a healthcare provider’s success story to demonstrate its impact.

Key Features of Executive Dashboard Software
1. Real-Time Data Integration
Dashboards that integrate data in real time allow executives to access the most up-to-date metrics. This capability ensures decisions are based on current conditions rather than outdated reports.
-
Why It’s Important:
-
Enables quick responses to operational issues or market changes.
-
Provides a dynamic view of performance metrics across departments.
-
Example: A logistics company uses real-time data to track delivery schedules, enabling them to reroute shipments during delays.
2. Customization Options
Every business has unique priorities, and a one-size-fits-all approach doesn’t work for executive dashboards. Customizable dashboards allow organizations to tailor the layout, metrics, and visualizations to meet their specific needs.
-
Why It’s Important:
-
Aligns the dashboard with organizational goals and executive roles.
-
Avoids clutter by focusing only on relevant KPIs.
-
Example: A retail chain customizes its dashboard to highlight inventory turnover rates and regional sales performance.
3. Mobile Accessibility
With the rise of remote work and global operations, executives need access to their dashboards on the go. Mobile-friendly dashboards ensure that key metrics are always within reach, regardless of location.
-
Why It’s Important:
-
Provides flexibility for traveling executives or remote teams.
-
Facilitates real-time decision-making outside the office.
-
Example: A CEO checks live sales data on their smartphone during an international business trip.
4. Cross-Departmental Visibility
Dashboards that integrate data from multiple departments give leaders a holistic view of the organization. This feature enhances collaboration by ensuring all teams are aligned on key objectives.
-
Why It’s Important:
-
Breaks down data silos to provide a unified perspective.
-
Supports coordinated decision-making across teams.
-
Example: A tech startup integrates sales, marketing, and customer support data into one dashboard, allowing executives to track the entire customer journey.
5. Interactive Visualizations
Data visualization tools like charts, graphs, and heatmaps make complex information easier to interpret. Interactive elements, such as drill-downs and filters, allow users to explore specific details.
-
Why It’s Important:
-
Simplifies data analysis and highlights trends at a glance.
-
Supports deeper insights by enabling users to focus on specific metrics.
-
Example: A financial manager uses heatmaps to identify underperforming business units quickly.
6. Automated Reporting
Dashboards with automated reporting capabilities save time and reduce manual effort. These reports can be scheduled or triggered by specific events, ensuring that stakeholders stay informed.
-
Why It’s Important:
-
Streamlines communication by delivering insights to stakeholders automatically.
-
Reduces the workload for employees tasked with generating reports.
-
Example: A healthcare provider schedules weekly reports on patient outcomes and resource utilization.
7. AI and Predictive Analytics
Advanced dashboards leverage artificial intelligence and predictive analytics to forecast future trends and suggest actionable strategies. This capability turns data into a proactive tool for decision-making.
-
Why It’s Important:
-
Anticipates challenges and opportunities before they occur.
-
Enhances strategic planning with data-backed predictions.
-
Example: A manufacturing firm uses AI-driven dashboards to predict machine maintenance needs, reducing downtime.
8. Role-Based Access Control
For organizations handling sensitive data, it’s essential to limit dashboard access based on roles and responsibilities. This feature ensures data security while allowing employees to focus on metrics relevant to their roles.
-
Why It’s Important:
-
Protects sensitive information by restricting unauthorized access.
-
Customizes views to match individual user needs.
-
Example: A hospital restricts access to patient data dashboards to authorized personnel, ensuring compliance with privacy regulations.
Real-World Use Case: A Healthcare Provider’s Success
A large healthcare provider faced challenges in managing patient outcomes and resource allocation across its network of hospitals. Data was fragmented across multiple systems, making it difficult for executives to track efficiency and performance.
The Solution:
The organization implemented executive dashboard software with the following key features:
-
Patient Outcome Tracking: Monitored metrics such as recovery times, readmission rates, and treatment success rates.
-
Resource Allocation: Tracked the availability and usage of beds, medical equipment, and staff.
-
Cross-Department Integration: Combined data from patient records, finance systems, and supply chain tools.
The Results:
-
Improved Efficiency: Real-time insights helped allocate resources where they were needed most, reducing wait times for patients.
-
Enhanced Decision-Making: Executives identified trends in patient outcomes and adjusted care strategies accordingly.
-
Streamlined Reporting: Automated reports on resource utilization saved hours of manual effort, enabling staff to focus on patient care.
How to Choose the Right Executive Dashboard Software
-
Assess Your Needs: Identify the metrics and features most critical to your organization.
-
Ensure Integration: Choose software that connects seamlessly with your existing tools and systems.
-
Prioritize User-Friendliness: Opt for dashboards with intuitive interfaces and easy customization.
-
Check Scalability: Select a platform that can grow with your business and adapt to changing needs.
-
Evaluate Security Features: Ensure the software includes robust data encryption and access controls.
Conclusion:
Executive dashboard software is more than just a data visualization tool—it’s a strategic asset that empowers leaders to make informed decisions quickly and effectively. By offering features like real-time data integration, customization options, and cross-departmental visibility, these dashboards provide a comprehensive view of organizational performance.
The healthcare provider’s success story highlights the transformative impact of using executive dashboards to streamline operations and improve outcomes. Whether you’re managing a hospital, a retail chain, or a tech startup, choosing the right dashboard software can unlock new levels of efficiency and insight.
Ready to find the perfect executive dashboard for your organization? Start exploring solutions that align with your goals and deliver the features that matter most to your success.


Subscribe to follow product news, latest in technology, solutions, and updates
บทความอื่นๆ


Let’s build digital products that are simply awesome !
We will get back to you within 24 hours!ติดต่อเรา Please tell us your ideas.


