Market Basket Analysis
Share

Have you wondered why daily used items such as milk and water get stored at the shop’s last corner instead of the shop’s entrance? Or the way these items get categorized? What about how retailers pick items that get packed as a promotion set? For large retailers, all these things aren’t random. Retailers use a data mining technique called market basket analysis to uncover associations between items. Market basket analysis uses a dataset of thousands or millions of buyer transactions to find relationships between items. The set of items a customer buys is referred to as an itemset.
Market Basket Analysis benefits
- Better location of items in-store to promote impulse buys.
- Selection of items for joint promotions and marketing programs.
- Enable categorization of shopper purpose and motivations.
- Help make decisions regarding store segmentation, customer segmentation, and target messaging.
How Basket Analysis benefits works
Market Basket Analysis uses rules that probabilistic in nature or, in other words, they are derived from the frequencies of co-occurrence in the observations.
Market Basket Analysis takes data at the transaction level, which lists all items bought by a customer in a single purchase. The technique determines relationships of what products were purchased with which other product(s). These relationships are then used to build profiles containing If-Then rules of the items purchased.
The rules could be written as:
If {A} Then {B}
{A} is called the antecedent.
{B} is called the consequent.
The antecedent is the condition and the consequent is the result. The association rule has three measures that express the degree of confidence in the rule, Support, Confidence, and Lift.
Now let’s define these three measurements.
Support: The number of times this rule occurred over the total transactions.
Confidence: The support for rule over the support for the antecedent.
Lift: is confidence over the probability of the outcome.
Okay, enough for the theory, let’s have an example, you are in a supermarket to buy milk. Based on the analysis, are you more likely to buy apple or cheese in the same transaction than somebody who did not buy milk?
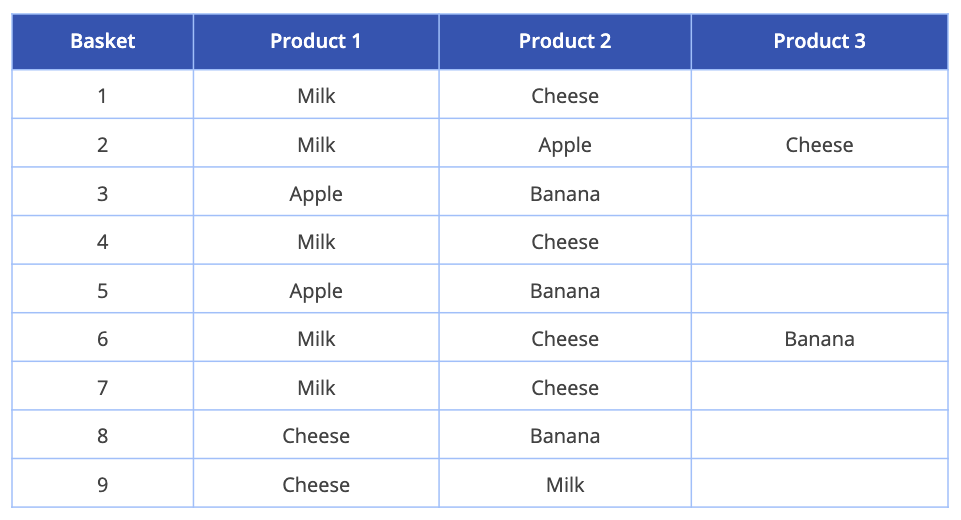
Consider we have a dataset of buyers transactions that contains 9 transactions with 3 products per transaction.
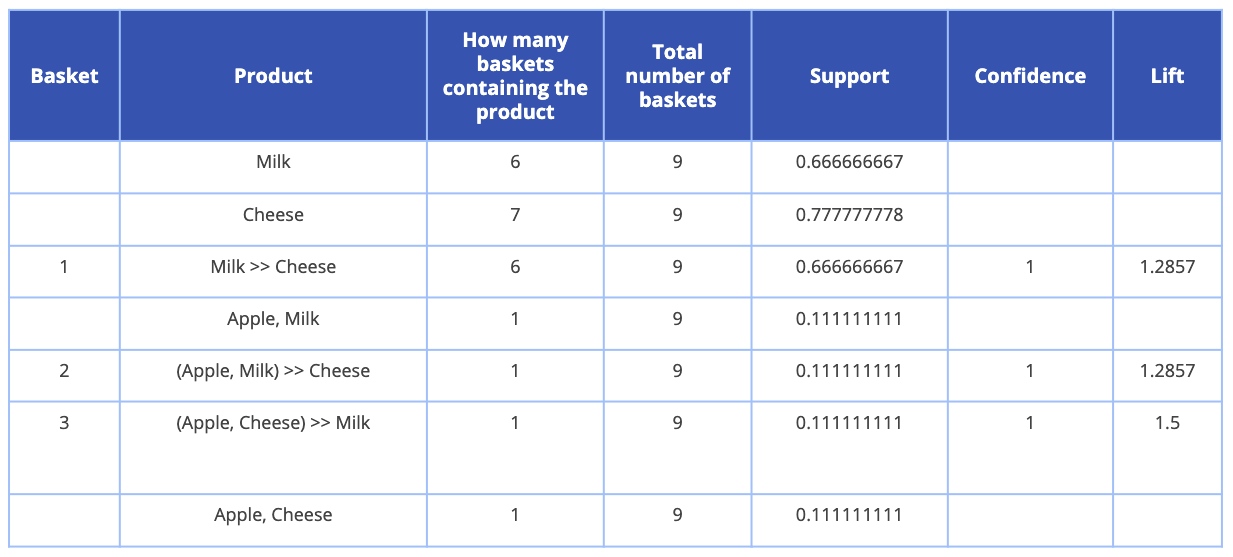
The next step is to determine the relationships and rules. For explanation purposes, the following table shows some of the relationships. In total there are 22 rules for the 9 baskets.
Based on the above table now we can determine which product(s) are most likely bought together.
Other application areas
- Banks: Market Basket Analysis can be used to analyze credit card purchases of customers to build profiles for fraud detection purposes and cross-selling opportunities.
- Telecommunications: In Telecommunications, where high churn rates continue to be a growing concern, Market Basket Analysis can be used to determine what services are being utilized and what packages customers are purchasing. They can use that knowledge to direct marketing efforts at customers who are more likely to follow the same path.
- Insurance: Identification of fraudulent medical insurance claims.
- Medical: In Healthcare or Medical, Market Basket Analysis can be used for comorbid conditions and symptom analysis, with which a profile of illness can be better identified. It can also be used to reveal biologically relevant associations between different genes or between environmental effects and gene expression.
Conclusion
At present, retailers are facing immense pressure due to the expansion of e-commerce, especially when it comes to bigwigs such as Amazon and Walmart Inc. Companies must analyze various trends from both online and offline channels to increase retail sales. In this article, we showed how Market basket analysis could be leveraged to analyze the changing retail market trends and market dynamics to gain a competitive edge in the market.

Share

Keep me postedto follow product news, latest in technology, solutions, and updates
Related articles
Explore all


