The Future of Executive Dashboards: Trends to Watch
Share
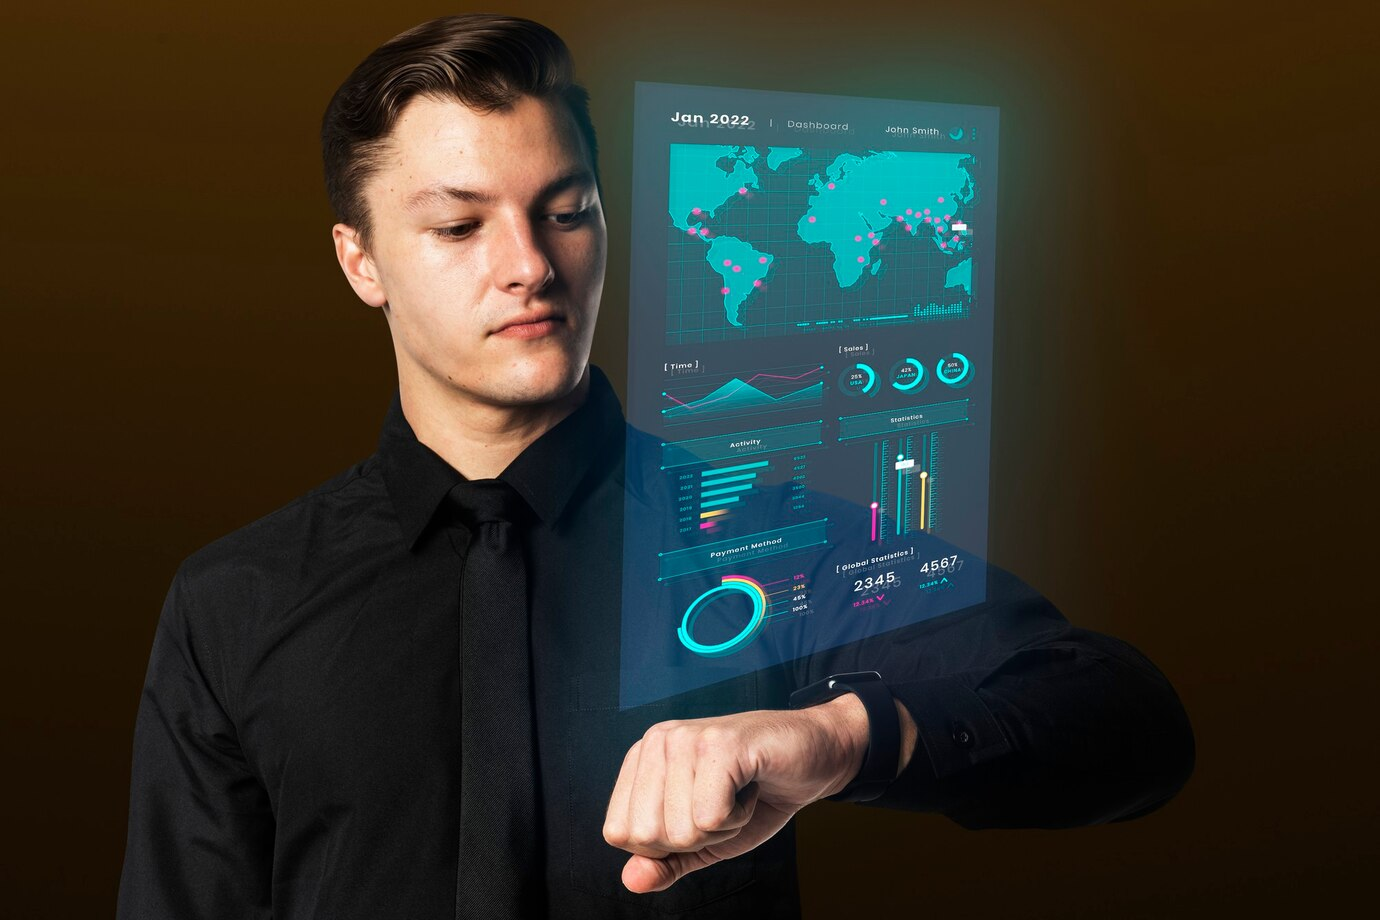
Executive dashboards have come a long way from static reports and basic visualizations. As technology advances, these tools are transforming into dynamic, intelligent systems that not only provide insights but also empower executives to make faster and smarter decisions. From augmented reality (AR) to voice-enabled queries and blockchain integration, the future of executive dashboards promises exciting innovations.
This article explores emerging trends shaping the next generation of executive dashboards, with a spotlight on how a global retail brand piloted an AR dashboard to revolutionize performance analysis.
1. Augmented Reality Dashboards
What It Is:
AR dashboards use immersive technology to display data in three-dimensional environments. Executives can visualize metrics such as sales performance, operational efficiency, and customer trends as interactive holograms.
Why It Matters:
-
Provides a new level of engagement by making data exploration more intuitive.
-
Enables spatial analysis of metrics, such as comparing store layouts or geographic sales trends.
Example:
A global retail brand piloted an AR dashboard that projected sales performance data for individual stores. Executives could “walk through” a virtual map, identify underperforming regions, and adjust strategies accordingly.
2. Voice-Enabled Data Queries
What It Is:
Voice-enabled dashboards allow users to interact with data using natural language commands, such as “Show me last quarter’s revenue trends” or “Compare sales across regions.”
Why It Matters:
-
Simplifies data access for non-technical users.
-
Increases efficiency by eliminating the need for manual navigation.
Example:
A healthcare CEO uses voice commands to retrieve patient outcome metrics during board meetings, enabling quicker decision-making.
3. AI-Driven Insights
What It Is:
Artificial intelligence (AI) integrated into dashboards enables predictive analytics, anomaly detection, and automated recommendations for strategic actions.
Why It Matters:
-
Turns dashboards from reactive tools into proactive decision-making aids.
-
Reduces the cognitive load on executives by highlighting trends and suggesting solutions.
Example:
A logistics company’s dashboard predicts delivery delays based on real-time weather and traffic data, recommending alternative routes.
4. IoT Integration
What It Is:
Dashboards connected to Internet of Things (IoT) devices can monitor equipment, track inventory, or analyze environmental conditions in real time.
Why It Matters:
-
Enhances operational efficiency by providing actionable insights from physical assets.
-
Supports industries like manufacturing, logistics, and retail with real-time monitoring.
Example:
A food distribution company uses IoT-enabled dashboards to track refrigeration temperatures during transit, ensuring product quality.
5. Blockchain for Secure Data Visualization
What It Is:
Blockchain integration ensures that data displayed on dashboards is tamper-proof and transparent, making it ideal for industries requiring high levels of security and trust.
Why It Matters:
-
Enhances data integrity by providing a secure, immutable record of transactions.
-
Builds trust among stakeholders, especially in finance, healthcare, and supply chain management.
Example:
A pharmaceutical company uses a blockchain-backed dashboard to track drug distribution and ensure compliance with regulatory standards.
6. Hyper-Personalization
What It Is:
Dashboards that use machine learning to adapt their layout, metrics, and insights based on individual user preferences and behavior.
Why It Matters:
-
Ensures executives focus on the most relevant data for their roles.
-
Improves user experience by automating repetitive tasks.
Example:
A marketing director’s dashboard automatically highlights campaign ROI metrics during quarterly planning sessions.
7. Mobile-First Dashboards
What It Is:
Dashboards designed primarily for mobile devices, offering seamless accessibility and usability for executives on the move.
Why It Matters:
-
Supports remote work and global operations.
-
Provides real-time insights anytime, anywhere.
Example:
A tech startup’s leadership team relies on a mobile dashboard to track software deployments and customer feedback during product launches.
8. Natural Language Processing (NLP)
What It Is:
Dashboards that understand written or spoken language queries, allowing users to generate reports or explore data without technical expertise.
Why It Matters:
-
Democratizes access to advanced analytics.
-
Reduces training time for new users.
Example:
A CFO types, “Show me expense trends for the last three months,” and the dashboard generates a detailed chart instantly.
9. Advanced Collaboration Features
What It Is:
Dashboards that integrate with communication platforms, enabling teams to share insights, annotate data, and collaborate in real time.
Why It Matters:
-
Enhances teamwork by aligning stakeholders on shared goals.
-
Speeds up decision-making by combining data analysis with discussion tools.
Example:
A retail chain’s regional managers collaborate on a dashboard to compare store performance and share best practices.
10. Gamification Elements
What It Is:
Incorporating game-like features, such as progress bars, achievement badges, or leaderboards, to motivate users and enhance engagement.
Why It Matters:
-
Encourages consistent use of the dashboard.
-
Drives performance improvements through friendly competition.
Example:
A sales team uses a gamified dashboard that awards badges for hitting weekly targets, fostering a competitive yet collaborative environment.
Real-World Use Case: A Global Retail Brand’s AR Dashboard
A leading global retailer piloted an augmented reality dashboard to visualize performance metrics across its international stores. The AR system allowed executives to explore a virtual map showing key metrics such as sales, foot traffic, and inventory levels.
Key Benefits:
-
Immersive Analysis: Executives could identify geographic trends by virtually “walking through” their global network of stores.
-
Strategic Insights: Real-time data visualization enabled quicker identification of underperforming regions and potential growth markets.
-
Collaboration: The immersive experience encouraged cross-departmental discussions and brainstorming.
Outcome:
The retailer improved decision-making speed and precision, leading to increased profitability and more targeted expansion efforts.
How Businesses Can Prepare for the Future of Dashboards
-
Invest in Scalable Platforms: Choose solutions that can integrate emerging technologies like AI and AR as they become more widely available.
-
Focus on User Experience: Prioritize dashboards that are intuitive and customizable to meet diverse needs.
-
Enhance Data Security: Ensure dashboards are equipped with robust encryption and access controls, especially for blockchain integration.
-
Stay Informed: Keep up with trends in dashboard technology to identify tools that align with your strategic goals.
Conclusion:
The future of executive dashboards lies in their ability to combine cutting-edge technology with user-centric design. From AR-powered data visualization to voice-enabled queries and AI-driven insights, these tools are evolving to meet the demands of modern leadership. The global retail brand’s success with AR dashboards showcases the transformative potential of these innovations.
Whether you’re managing a small business or leading a global enterprise, embracing the next generation of dashboards can empower you to make smarter, faster, and more impactful decisions. Ready to explore what the future holds? Start adopting forward-thinking dashboard solutions today and stay ahead of the curve.

Share

Keep me postedto follow product news, latest in technology, solutions, and updates
Related articles
Explore all