How to Use SUS Score to Evaluate Mobile App Usability
Share

How do you measure usability? While usability testing often relies on qualitative feedback—watching users interact with your app, listening to what they say—quantitative metrics are equally valuable. They give your team a benchmark, help track improvement over time, and bring objectivity to UX decisions.
One of the simplest and most trusted tools for this is the System Usability Scale (SUS).
Originally developed in the 1980s, the SUS remains widely used across industries to evaluate software, websites, and mobile apps. It provides a reliable “score” of perceived usability—and it only takes a minute or two to complete.
In this article, we’ll explain what the SUS is, how to implement it in your mobile app testing, and how one healthcare app used it to maintain a consistently high standard of usability throughout development.
What Is the SUS?
The System Usability Scale is a 10-question questionnaire that asks users to rate their agreement with various usability-related statements on a 5-point Likert scale (from "Strongly Disagree" to "Strongly Agree").
Each item alternates between positive and negative framing to encourage thoughtful responses.
Here are some example statements from a typical SUS survey:
-
I think I would like to use this system frequently.
-
I found the system unnecessarily complex.
-
I thought the system was easy to use.
-
I felt very confident using the system.
Once users complete the questionnaire, their answers are converted into a score out of 100. This final number doesn’t represent a percentage of perfection, but rather a standardized usability rating.
Why Use the SUS in Mobile App Testing?
1. It’s Fast and Lightweight
The SUS can be completed in under 2 minutes. It doesn’t require specialized tools, and it can be delivered in print, digital form, or integrated into your test flow.
2. It’s Quantitative
Instead of vague impressions (“users found it okay”), the SUS gives you a specific number that you can track over time.
3. It’s Comparative
You can compare your app’s score to benchmarks across industries or track improvements across product versions.
4. It Complements Qualitative Testing
Use SUS after a usability test session to capture users’ perceptions numerically, supporting the qualitative observations from task completions and interviews.
How to Administer the SUS
-
Choose the Right Timing
Administer the SUS immediately after a user completes a set of usability tasks. This ensures the experience is fresh in their mind.
-
Explain Its Purpose Briefly
Let participants know their responses will help improve the app's design. Reassure them there are no right or wrong answers.
-
Use a Standard Questionnaire
Keep the 10-item format unchanged. The power of SUS lies in its consistency.
-
Collect Responses Anonymously (if possible)
This encourages honesty. Users may be more candid when they know their answers aren’t linked to their identity.
How to Calculate the SUS Score
Each question is scored on a scale of 0 to 4, based on the user's rating:
-
For odd-numbered questions (positive tone), subtract 1 from the user’s score.
-
For even-numbered questions (negative tone), subtract the user’s score from 5.
-
Add all the adjusted scores together.
-
Multiply the total by 2.5 to convert it to a score out of 100.
Example:
If the total adjusted score is 28, then the SUS score is 28 × 2.5 = 70.
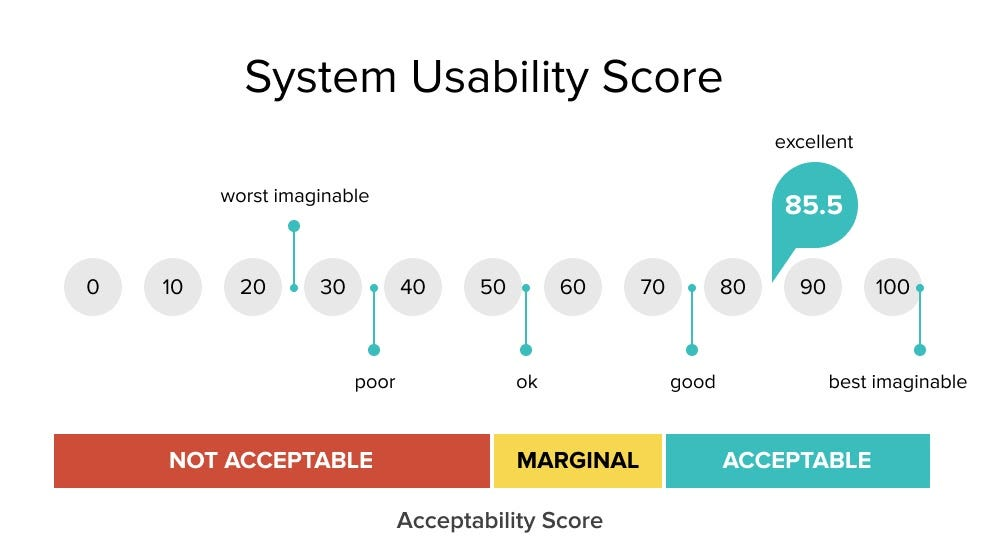
How to Interpret the SUS Score
-
Above 80: Excellent usability (users are very satisfied)
-
70–79: Good usability (but still room for refinement)
-
60–69: Marginal (some usability concerns)
-
Below 60: Poor usability (requires major changes)
These benchmarks aren't rigid, but they help teams gauge whether an app is “ready” from a usability standpoint.
Real Use Case: SUS in Agile Healthcare App Development
A healthcare platform built a mobile app to help patients manage medications, track vitals, and schedule virtual appointments. Since usability directly impacted user safety and compliance, the team needed a consistent, quantitative way to evaluate progress.
They embedded the SUS survey at the end of each usability test round in their agile sprints.
What happened:
-
Early sprints yielded average scores around 65.
-
Issues included confusing navigation and unclear labels.
-
After resolving these blockers, scores improved to the 75–80 range.
-
Any sprint with a SUS score below 70 triggered a design review before release.
The impact:
By using the SUS consistently, the team could measure improvement, track user satisfaction over time, and ensure that the app's usability met the high standards required in healthcare. The result was a better product—and stronger trust from users.
Tips for Using SUS Effectively
-
Use it regularly: Run SUS tests after major feature additions or design changes.
-
Keep context consistent: Ask users to complete the same tasks before each SUS session for more reliable comparisons.
-
Don’t rely on it alone: SUS is a valuable metric, but pair it with behavioral data, task success rates, and open-ended feedback.
-
Look for trends: Individual scores vary, but changes over time tell a meaningful story.
-
Set internal benchmarks: Define your own “acceptable” range for usability based on user expectations and industry demands.
Final Thoughts
Usability is a moving target. Features change, designs evolve, and user expectations grow. The System Usability Scale gives teams a simple but effective way to keep pace.
By integrating SUS into your usability testing process, you create a reliable feedback loop that quantifies user satisfaction and highlights issues before they become costly to fix.
Whether you're launching your first app or refining a mature product, SUS can help you measure what really matters: how usable your app feels to the people who depend on it.

Share

Keep me postedto follow product news, latest in technology, solutions, and updates
Related articles
Explore all